 AI
AI
The Spreadsheet Phase Captures Outputs, Not Insights
Spreadsheets are the lowest barrier to entry for evals. Teams write a for loop over input examples and record outputs manually. Phil Hetzel calls this phase “documenting, not experimenting.” Comparing experiments over time becomes cumbersome. Human scorers cannot scale. Non-technical stakeholders rarely touch the sheet. Without analytics or persistence, returns diminish quickly. Most teams never leave this phase without a platform.
Custom UIs Add Reporting, Not Iteration
The next step is a custom UI built with vibe coding. Teams swap the spreadsheet for a bespoke interface and a proper database like Neon. More people can view results, but Hetzel argues the platform is still a reporting tool. Users see scores without the ability to tweak parameters and run side-by-side experiments. The focus shifts from documentation to display, not iteration. Maintaining the custom platform becomes the developer’s ongoing job.
Playgrounds Enable True Experimentation
Experimentation requires a sandbox where users tweak agent configuration like system instructions. Hetzel shows a UI comparing two prompt variants side by side, with scores bubbled up automatically. This is the “rubber meets the road” phase: teams find failure modes by running evals across configurations. The playground must serve both technical and non-technical users. Without it, teams stay in reporting mode and never discover unknown failure modes.
Connecting Observability Creates the Eval Loop
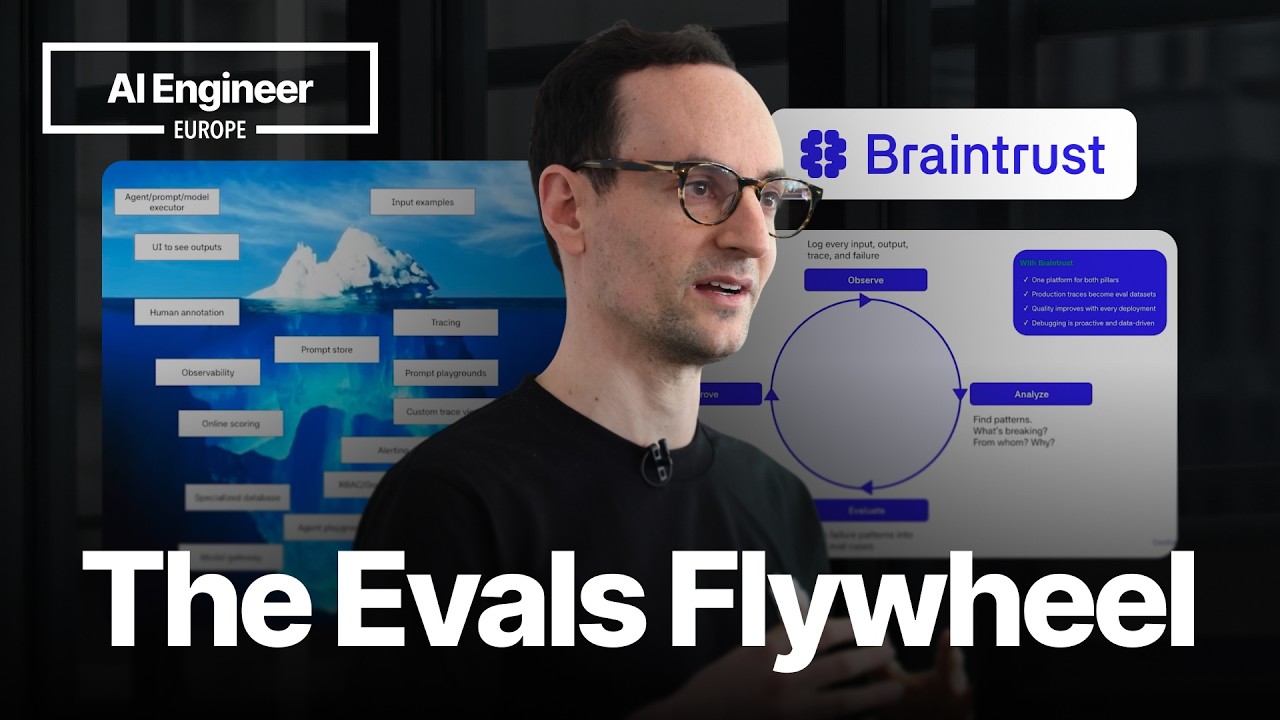
The flywheel connects production observability to offline evals. Hetzel explains that Braintrust started as an evals-only platform until a customer piped all production traffic into it every hour. That customer was essentially running online evals. Teams should rerun production traces in a safe environment to find real failure modes. This loop turns the platform into a tracing and logging system. Performance becomes critical: trace spans can be 10-20 megabytes, not kilobytes.
The Data Layer Is the Hardest Part
Eval platforms are a systems engineering problem, not a UI problem. Hetzel describes Braintrust’s early architecture: a low-latency ingest layer, a data warehouse for aggregate analysis, BTQL as a custom query language that “no one liked”, and DuckDB in the browser. A customer like Notion needed full-text search across millions of traces. Traditional span sizes of a few kilobytes balloon to 10-20 MB per span. The data comes fast, large, and unstructured.
Q&A
How does Braintrust handle multimodal inputs and outputs in traces? Braintrust stores them in object storage, references them, and displays them inline in the trace so users don’t have to leave the platform. ▶ Watch (24:44)
Notable Quotes
I would call this documenting. It it’s not really experimenting. Phil Hetzel · ▶ Watch (9:32)
If you build it, you have to manage it. Phil Hetzel · ▶ Watch (16:51)
We recognize that it’s quite easy to vibe code the UI of evals, but it’s way way way more challenging to create that data layer Phil Hetzel · ▶ Watch (19:41)
Don’t make me look across a whole bunch of traces. Just tell me how people are using our agent. Phil Hetzel · ▶ Watch (22:57)
Key Takeaways
- Spreadsheet evals become documentation; teams must move to playgrounds for real iteration.
- Connecting observability to evals creates a feedback loop that finds unknown failure modes.
- The hardest part of eval platforms is the data layer, not the UI—traces are large, fast, and unstructured.